
时间序列异常检测相关论文简要解读,以工业界算法&框架为主。
Review
2021-A review on TSAD
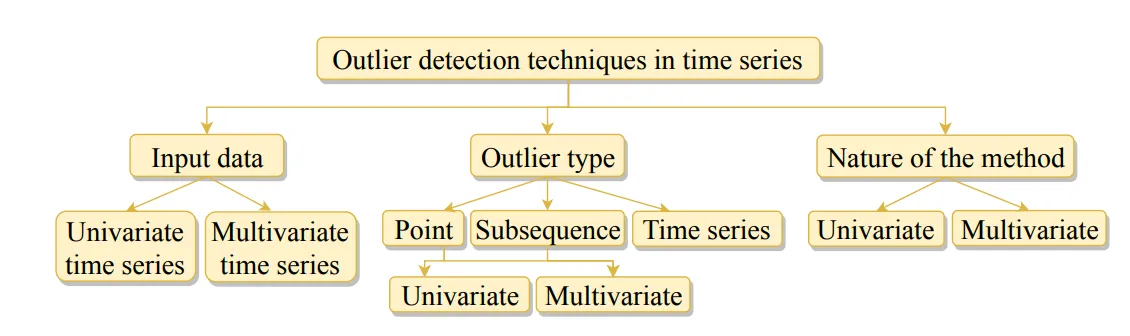 A review on outlier/anomaly detection in time series data1.
论文对一元和多元时间序列在 Point outlier, Subsequence outlier 和 Outlier time series 的检测算法进行了 详尽的介绍。总共涵盖了近几十年来的几十个算法,并对每个算法进行了简单的介绍和分类。 同时论文给出了一些算法的开源代码仓库,方便直接测试并应用相关算法。
2022-A Comprehensive Evaluation on TSAD
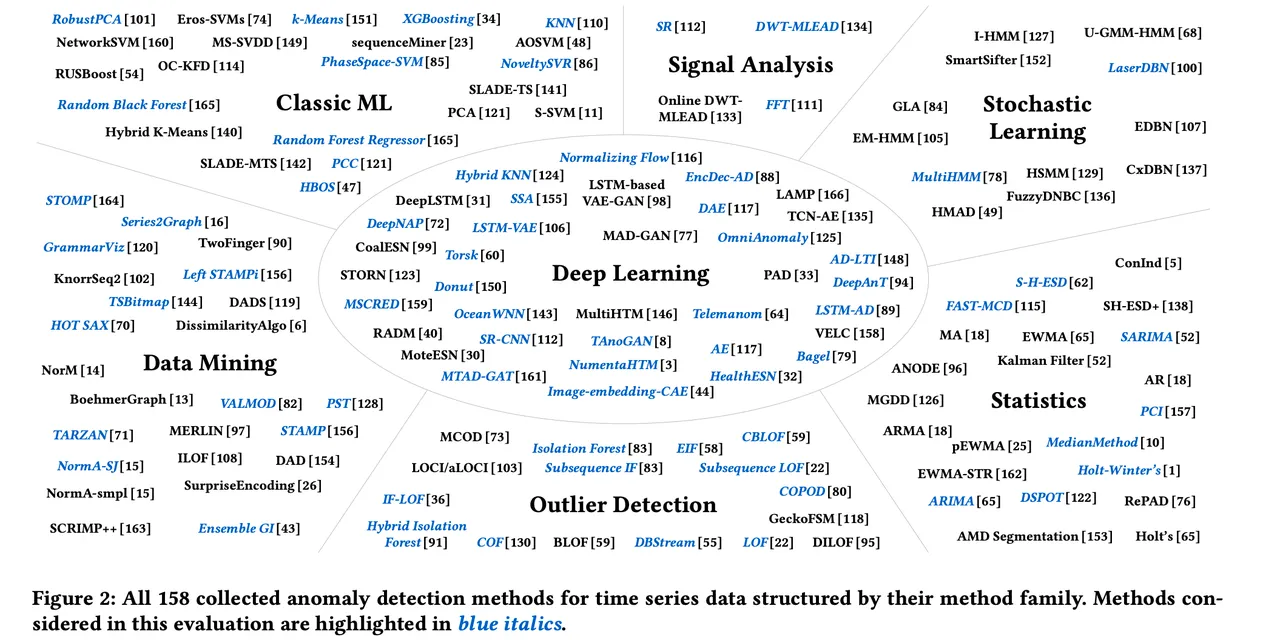
Anomaly Detection in Time Series: A Comprehensive Evaluation2. 论文收集了来自 Statistics, Stochastic Learning, Signal Analysis, Classic ML, Data Mining, Outlier Detection 和 Deep learning 共 7 个领域累计 158 种异常检测算法,并选取其中 71 个有代表性的 算法在 976 个时间序列数据集上进行了测试验证和水平对比,总结出 14 个 RI(Research Insight).
这些 RI 提供了一个足够广阔的视角和相当实用的方法论,这对我们实际落地实现有很大的帮助。 这里列举其中一些和我个人实践经验非常匹配的几个结论:
- Deep learning approaches are not (yet) competitive despite their higher processing effort on trainning data
- There is no one-size-fits-all solution in the set of currently available algorithms…there is no clear winner
- Simple methods yield performance almost as good as more sophisticated methods
- Every practical algorithm deployment needs careful testing
- Anomalies on periodic time series are easier to detect than on non-periodic time series
2023-IS IT WORTH IT?
IS IT WORTH IT? COMPARING SIX DEEP AND CLASSICAL METHODS FOR UNSUPERVISED ANOMALY DETECTION IN TIME SERIES
3.
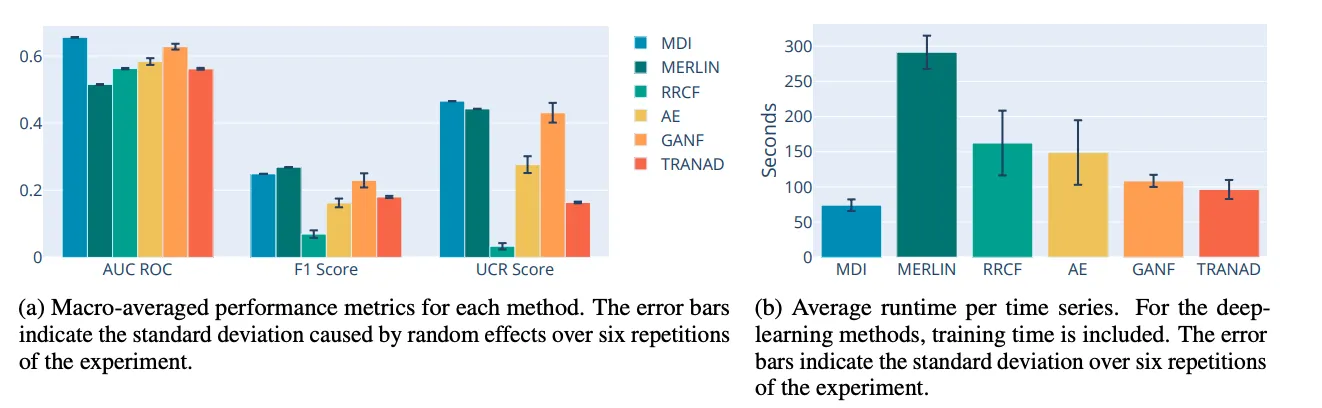 论文选取了用于时序异常检测的三种统计机器学习算法 (MDI, MERLIN, RRCF)
和三种深度学习算法 (AE, GANF, TRANAD), 对这六种算法进行了详细的水平对比。
最后的结论是发现深度学习的效果其实并不如统计机器学习算法。这点和上述 Comprehensive Evaluation4
中得到的结论是一致的。
论文选取了用于时序异常检测的三种统计机器学习算法 (MDI, MERLIN, RRCF)
和三种深度学习算法 (AE, GANF, TRANAD), 对这六种算法进行了详细的水平对比。
最后的结论是发现深度学习的效果其实并不如统计机器学习算法。这点和上述 Comprehensive Evaluation4
中得到的结论是一致的。
2023-New Trends in Time-Series Anomaly Detection
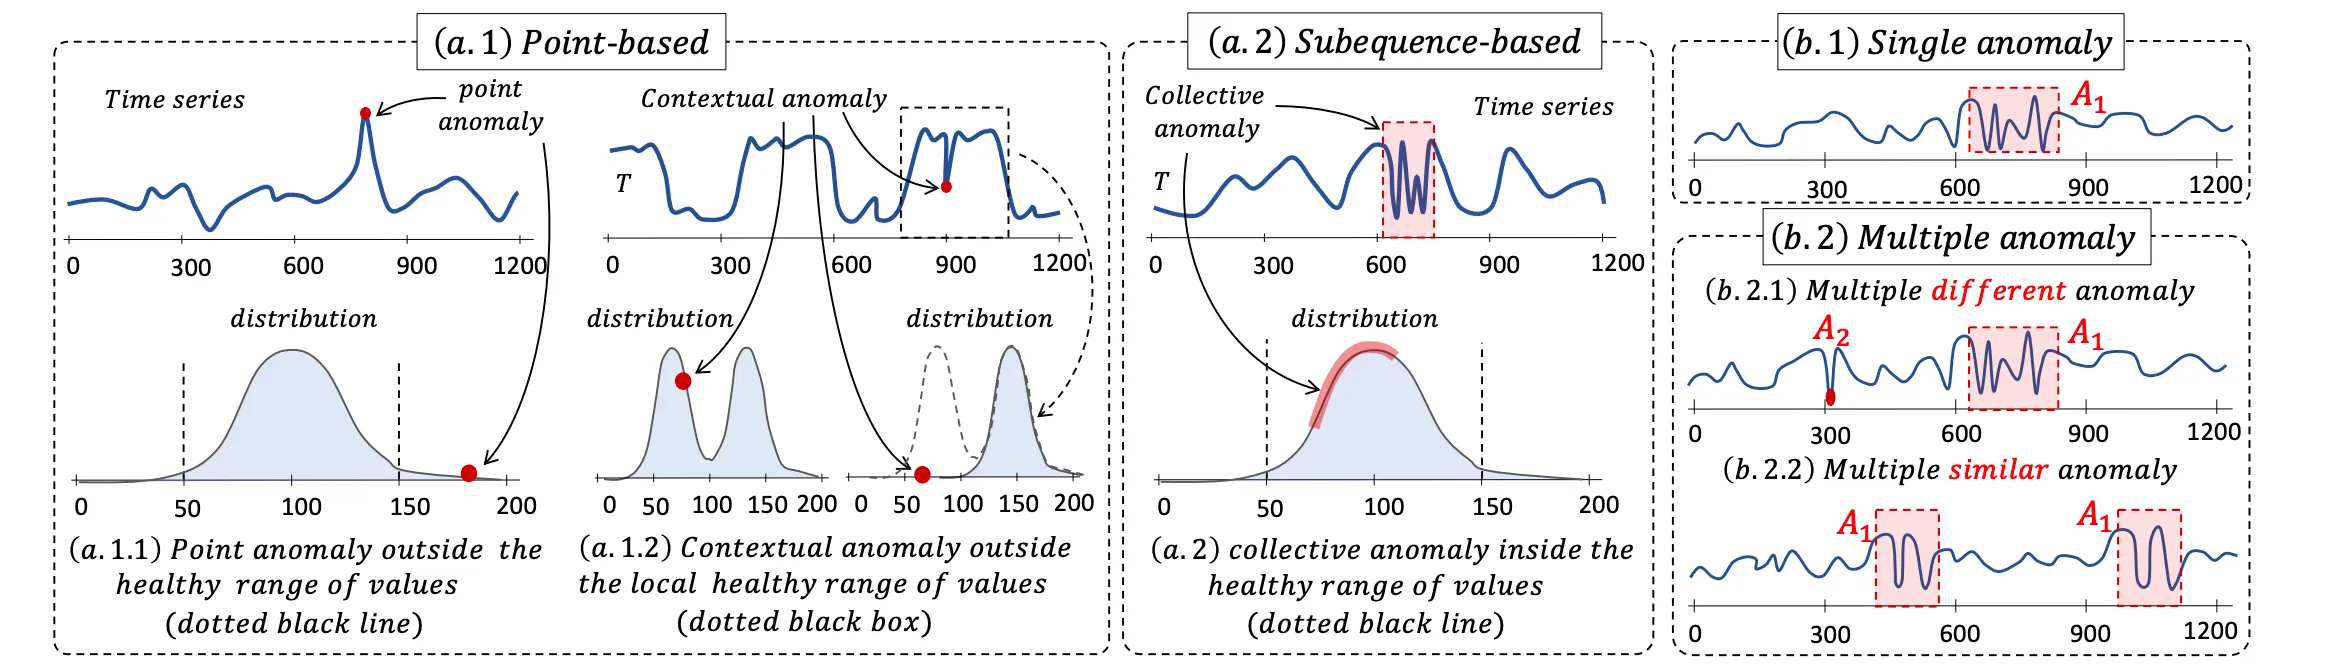
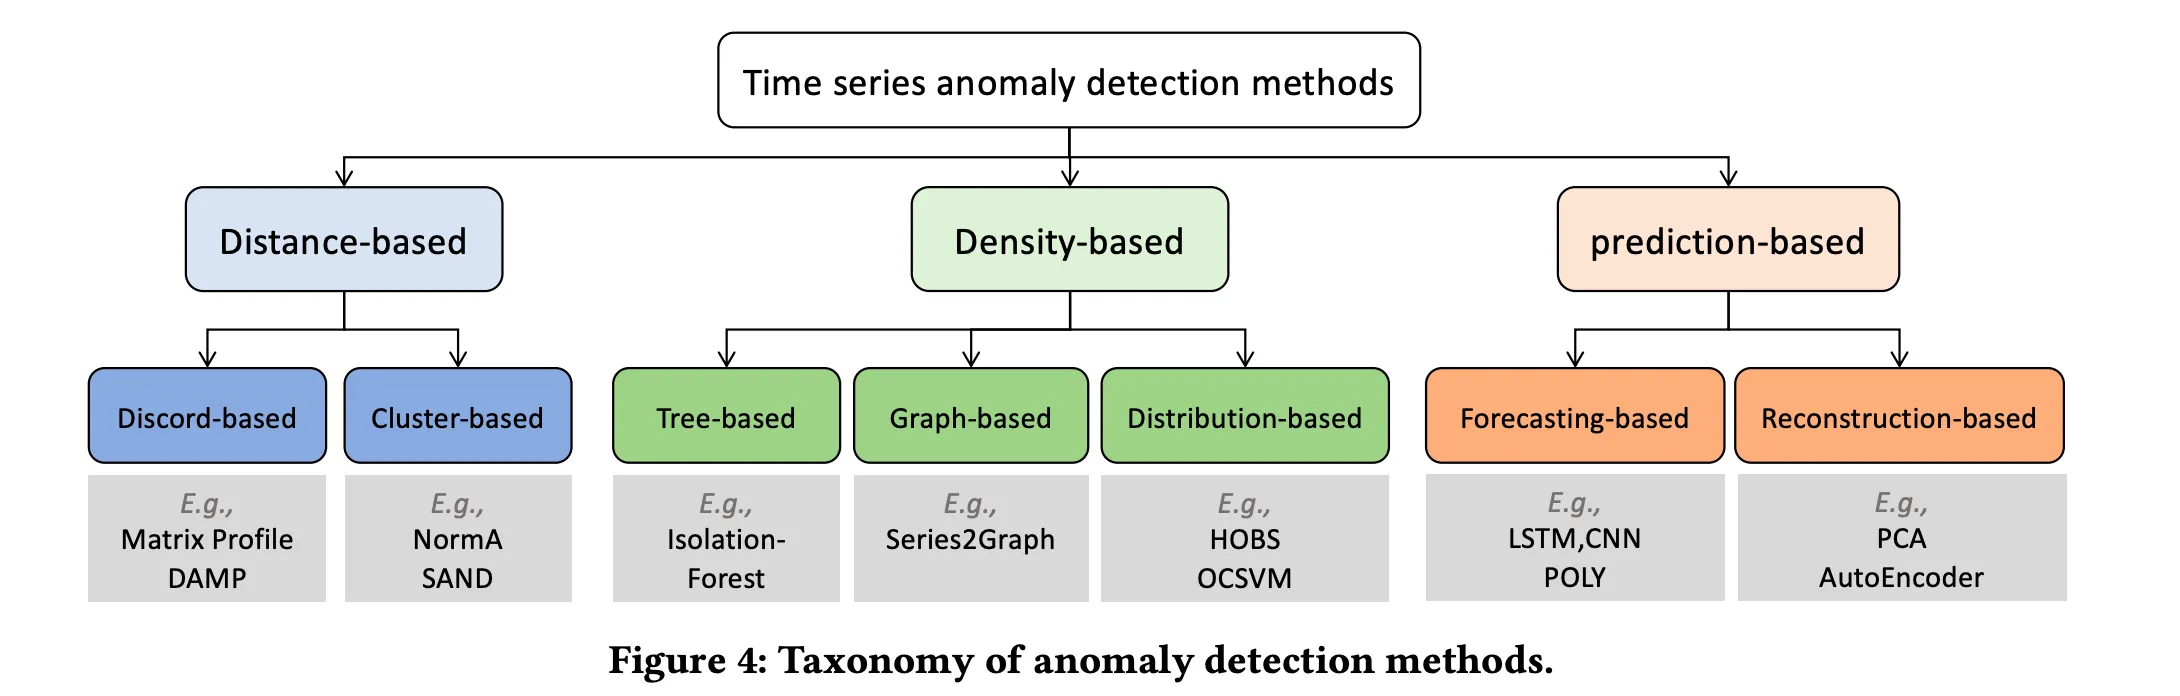 New Trends in Time-Series Anomaly Detection5.
Paul Boniol新出的综述,对时序异常的类型和检测算法进行了进一步的划分。
New Trends in Time-Series Anomaly Detection5.
Paul Boniol新出的综述,对时序异常的类型和检测算法进行了进一步的划分。
Systems
2017-Twitter-ESD
GitHub Resources
- Github
- Twitter 官方 (R 语言实现,注意目前已经不再维护): twitter/AnomalyDetection
- 个人项目 (Python 实现): shenxiangzhuang/pysesd
- Paper
H-S-ESD6是较早的时序异常检测系统, 主要理论依据为时序 STL 分解与 ESD(Extreme Studentized Deviate test)。 在后来的研究中也可以看出,这种基于时序分解的思想本质上从属于时序转化的思想: 当原始序列的异常不容易检测时,将其转化为更容易检测的序列,通过对进行异常检测以达到检测异常的目的。
大道至简
个人感觉这篇文章在整个时序检测领域的地位是相当高的。其基于变换(或时序分解)的思想在后续的很多工作中都有体现。 另外就是文章整体的思路明显是工业界注重解决问题的路子————简单实用——这对算法的落地部署相当的重要。
2020-Alibaba-RobustX
GitHub Resources
- Github
- LeeDoYup/RobustSTL
- (Unofficial)ariaghora/robust-period
阿里达摩院基于 STL 分解的思路利用深度学习做了一系列的创新研究。 分别有 RobustTrend7, RobustSTL8, 和 RobustPeriod9, 最后以 RobustTAD10将上述算法集成的一个统一的异常检测系统。 其整体上体系还是根植于最早 Twitter 的 STL+ESD 的结构。 另外这一系列算法在标准数据集上的表现可能尚可,但是根据对其中部分算法的测试发现算法性能较差, 在实际部署的时候可能存在性能瓶颈或者需要较大的资源开销。
仅供参考:-)
对比上面Twitter的方案就能看出这个系列的工作基本也是走时序分解的路子。但是不同的地方在于 Robust系列的工作玩的有点太花了,落地的难度更大,也没有那么实用。之前测试过其中一些方法的 使用,运行效率确实是差的。
2020-Amazon-GluonTS
GitHub Resources
- Github
GluonTS11主要专注于时间序列概率模型。
2020-Zillow-Luminaire
GitHub Resources
- Github
Luminaire12列出了当前时序异常检测系统的挑战,并针对性地给出了解决方案, 形成了一套基于无监督检测算法的简单易用全自动的系统。
2020-Microsoft-Auto-Selector
Auto-Selector13是微软提出的一种自动做模型选择的时序异常检测框架。
2021-Salesforce-Merlion
GitHub Resources
- Github
Merlion14是针对时间序列设计的一个比较完备的系统, 架构清晰,易用性强,具有较大的落地参考价值。
Merlion 具有很强的落地参考意义
Merlion系统整体的设计比较完备,在之前的算法落地工作中曾经参考过相关的设计。
2021-Linkedin-Silverkite
GitHub Resources
- Github
Silverkite15专注于时间序列的预测,也是通过对时间序列进行变换分解的思路。 基于之前对 Twitter 和 Alibab 系统的介绍,当然我们也可以将其应用于时序异常检测。
2022-IBM-AnomalyKiTS
GitHub Resources
AnomalyKiTS16是专门针对时间序列异常检测设计的系统,专注于无监督和半监督算法。
2022-MicroSoft-HEAT-RL
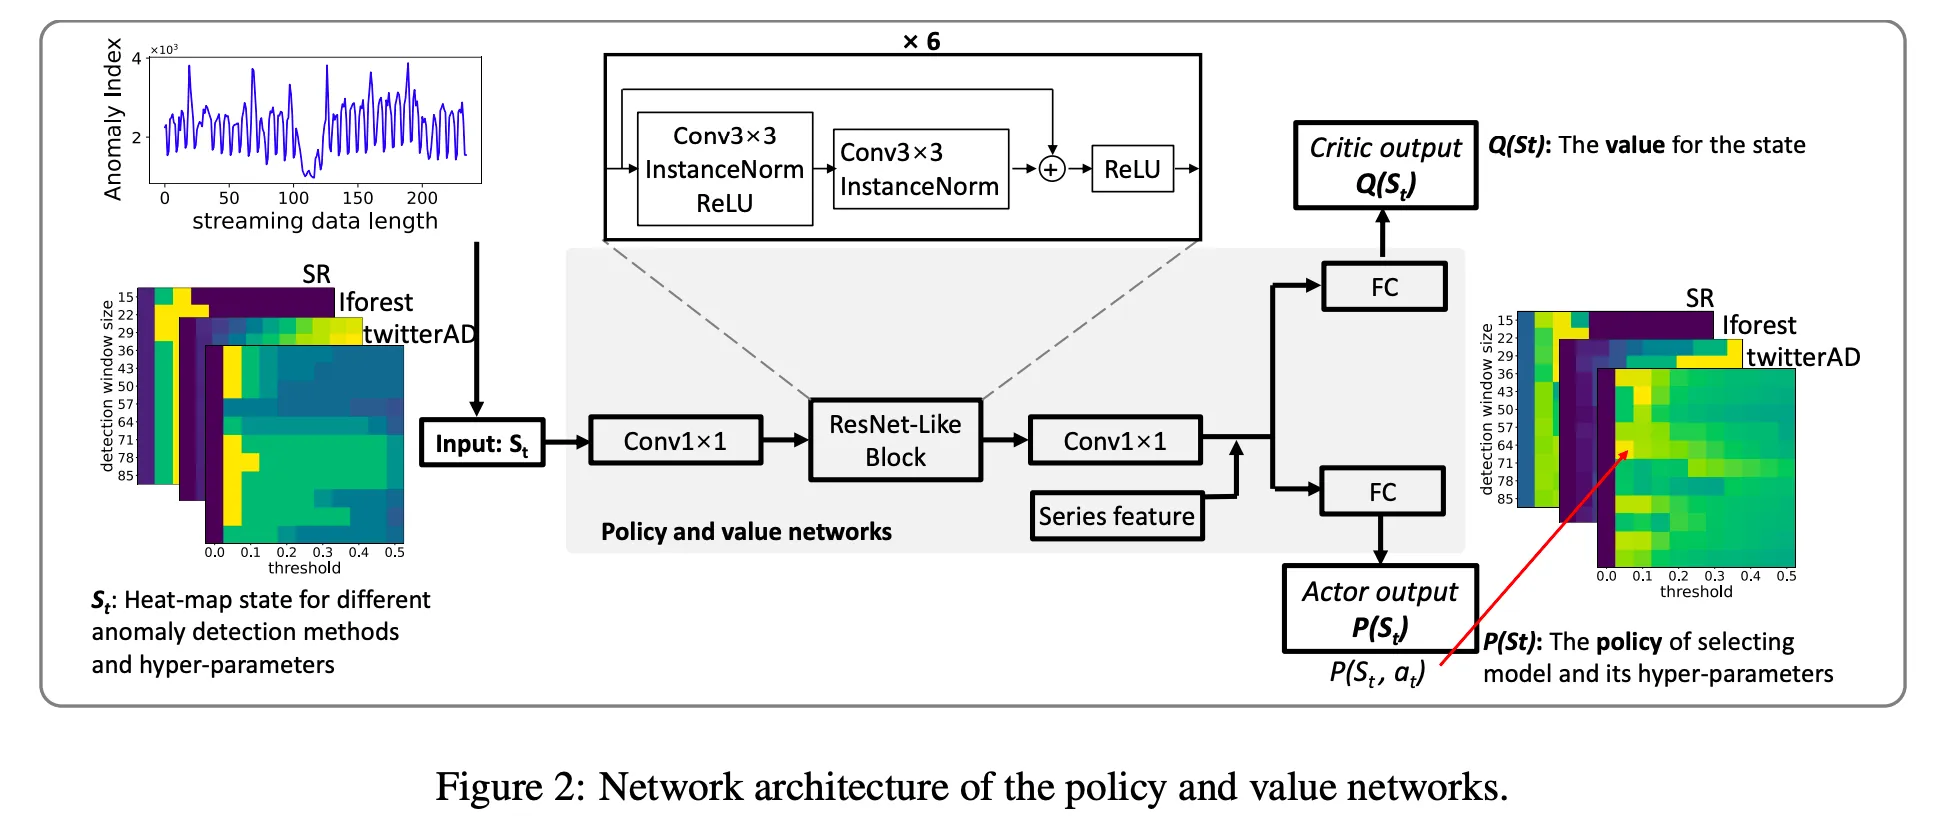 HEAT-RL17是微软的一篇关于时序异常检测系统中如和模型自动选择的文章。
论文选取 SR, IForest 和 TwitterAD 作为基础的时序异常检测算法,然后利用强化学习通过用户反馈来调整各模型的参数。
个人感觉这个方法总体来说还是有些太重了,可以作为成熟系统的拓展尝试。
HEAT-RL17是微软的一篇关于时序异常检测系统中如和模型自动选择的文章。
论文选取 SR, IForest 和 TwitterAD 作为基础的时序异常检测算法,然后利用强化学习通过用户反馈来调整各模型的参数。
个人感觉这个方法总体来说还是有些太重了,可以作为成熟系统的拓展尝试。
最后比较有意思的一点是,论文用 online click-through rate(CTR) 来衡量该算法带来的收益:
After shipping the Heat-RL algorithm to a commercial monitoring service, the online click-through rate (CTR) of anomaly alerts has been improved by 29.9% (Figure 8). Online CTR indicates the probability of a customer to click into the system portal after receiving an anomaly alert, which reflects how much the customers trust our anomaly detection results. Therefore, higher CTR score indicates better user satisfaction
2023-Amazon-Unsupervised Model Selection for Time-series Anomaly Detection
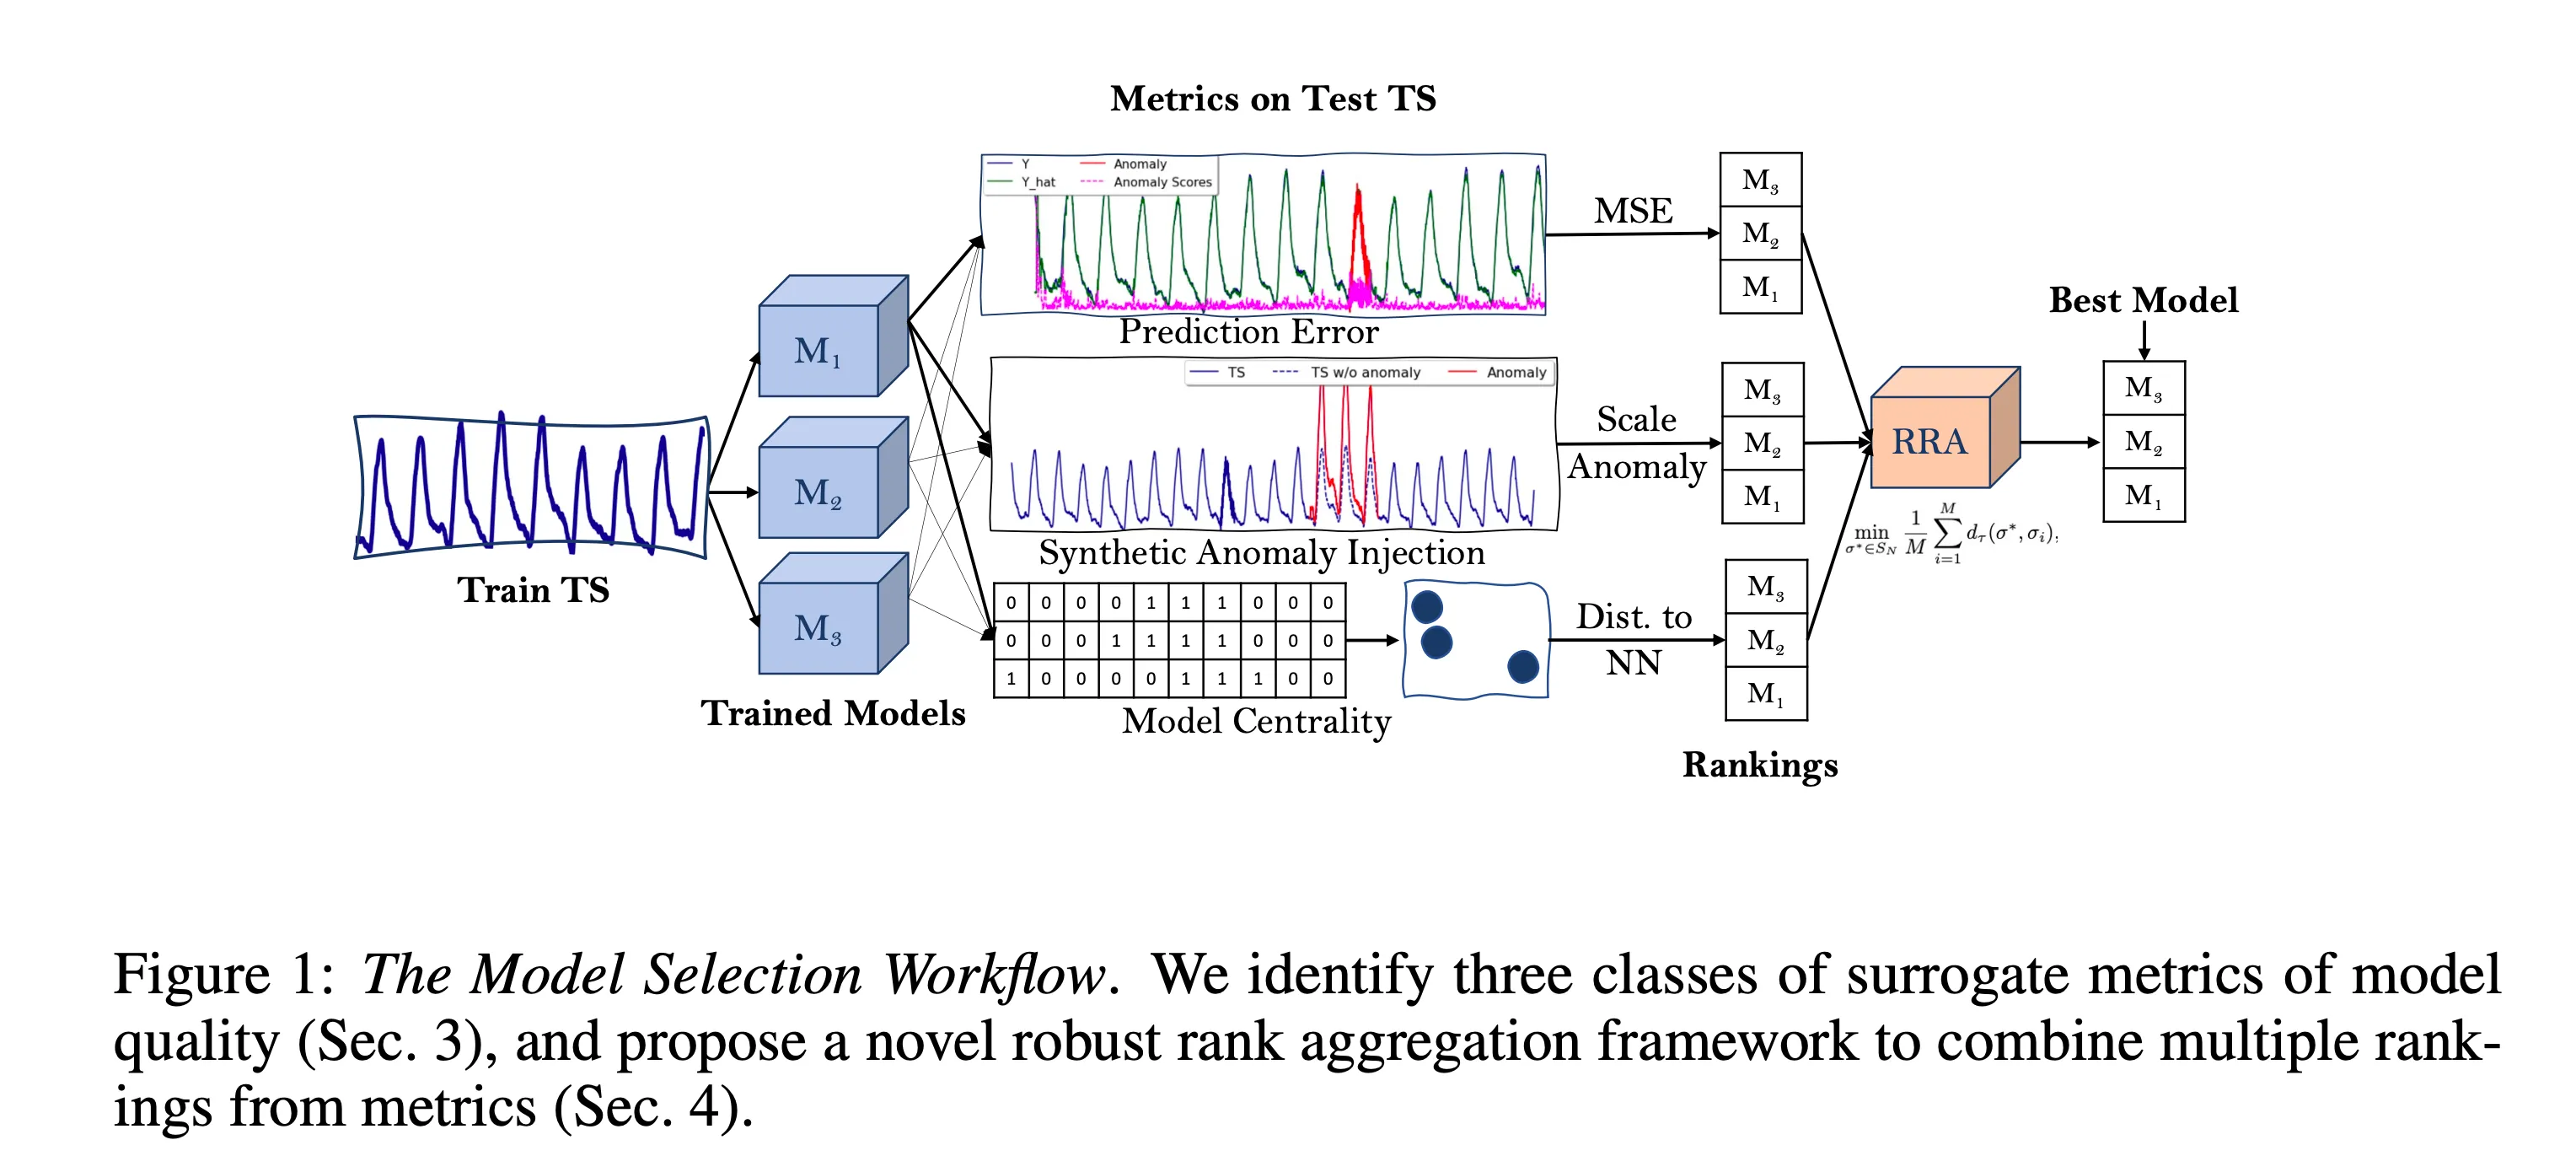 CMU 和 Amazon 合作的关于时序异常检测模型选择的文章18, 整体还是比较有参考意义的。
Algorithms
2016-Amazon-RRCF
GitHub Resources
- Github
RRCF19较为通用的多指标异常检测算法, 其原始模型虽然没有考虑太多时序的问题,但是我们可以将滚动窗口的时序特征抽取出来作为新的指标特征加入模型 以完成针对指标时序特征的建模。
2017-IRISA-SPOT
Abstract
:simple-thealgorithms: 算法 · :octicons-beaker-24: 适合 POC · :material-airplane-landing: 适合落地
SPOT 开源实现
- Github
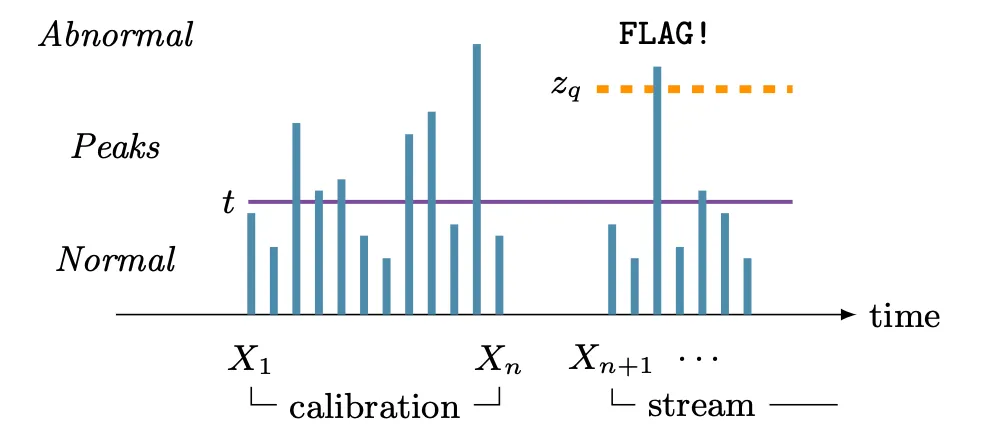
SPOT20是基于 EVT 的极值点异常检测算法, 作者是Alban Siffer. 这篇论文是我个人非常看好的工作,适当的复杂度, 较强的可解释性和很好的可适用性使得该算法非常适合在工业生产环境中落地。
Spot 算法简洁实用,可解释性强,工业落地表现整体还不错
之前的工作中大量使用Spot算法(及其衍生算法,如下面要介绍的FluxEV)。 因为Spot算法的理论基础是极值理论,所以具有较强的可解释性和可拓展性。
关于Spot在工业环境的应用涉及到的问题还比较多,如原始算法中,模型是需要 单步更新的(每个时间点的数据点进入都需要检验是否需要更新)。 一般模型存放在Redis,这种模型更新最坏情况下会使得模型数据的读写比为1:1, 这与一般Redis多读少些的场景有些不同,写入更频繁会更容易达到Redis的读写瓶颈。 后续有时间会单独把落地这部分系统整理下。
2021-Huawei-FluxEV
Abstract
:simple-thealgorithms: 算法 · :octicons-beaker-24: 适合POC · :material-airplane-landing: 适合落地
FluxEV21是一个波动异常检测算法,主要用于指标陡升陡降的检测。 其本身检测准确率很高,可以精准地捕捉到指标的各种非异常的波动。 但是其也存在各种缺点,如算法复杂度略高,这在大规模部署的时候存在较大的性能问题,会占用过多的机器资源等; 另外算法本身要求指标具有周期性,而且需要相当多个周期的数据,这使得其适用范围变的比较窄。 针对算法存在的这些问题和出于实用考虑我们可以针对性的做若干改进: 去除周期性相关部分;在连续异常的时候自动将 EWMA 窗口做 Level Shift(通过将历史异常点换存在模型即可做到) 等。
FluxEV 算法结合 Spot 和时序分解的优秀后继者
忽略论文中做得一些辅助性工作,FluxEV本质上是将时序做变换, 得到残差序列,之后让残差序列进Spot算法做异常检测。这种变换使得时序上非极值异常的检测更加简单, 变换会突出Change Points, 所以能够更好地检测突变点。
因为算法整体复杂度相比Spot会稍高一些,所以工程实现上会更加繁琐一些。
FluxEV 开源实现
论文作者开源:jlidw/FluxEV
pyoats 集成:pyoats
2021-NUS-MemStream
MemStream22明确地提出 Memory 的概念, 相对于 Matrix Profile 更加的轻量,相对于其他的多指标异常检测算法具有更多的可解释性。
2022-EDF-Series2Graph
Series2Graph23, GraphAn24和 DADS25 是 Series2Graph 系列的三篇文章:其中 Series2Graph 是主要的算法部分 (主页),GraphAn 强调问题与挑战, DADS 专注于时序异常检测分布式系统的实现,具体采用 Actor Programming Model 实现,具体参考Github。
2024-EDF-kGraph
Abstract
:simple-thealgorithms: 算法 · :octicons-beaker-24: 适合POC
kGraph: Graph Embedding for Interpretable Time Series Clustering 是一篇关于时序聚类的文章,主要是基于图嵌入的思路,对时序数据进行聚类。
Series2Graph 作者Paul Boniol最新在做的开源项目,目前还在开发中 (V0.0.1 版本), 不过核心的功能已经有了,而且还放出了一些示例数据和示例代码。 (没看到论文,问了下作者,说是还没发出来)
个人认为 Series2Graph 是一种非常有前景的图嵌入算法,可以很好地对 time series/sequence进行表征, 所以下游无论是接聚类任务还是异常检测任务都能有比较好的表现。 不过缺点就是算法还是基于 sequence/subsequence 的, 所以很对实时性要求比较高的任务 (这时候处理的对象更多的是 point) 还是不太适合。
point->sequence?
sequence = sequence[:-1] + [point]的方法可以将point转化为sequence, 所以是可以强行用的,但是意义可能并不大。因为单个point带来的sequence的变化可能没有 那么大,除非做加权处理,但是这个权也不太好加,又引入新的复杂度,所以还是不太好处理的。
另外就是 Series2Graph 的算法原理,个人感觉真的挺难理解的…对这个 sequence 嵌入的过程,看了好久都很难 得到一些 insight。个人来说,在获得一定程度的 insight 之前,都是不太敢用这个算法做实际的落地工作的,最多做一下 POC, 主要是担心遇到问题之后没办法改进——这点还挺重要的。
尽管有这些问题存在,Series2Graph 系列的算法的表现还是很不错的 (之前是在生产环境的数据上粗略验证过的),所以还是值得一试的。
2024-Microsoft-Anomaly Detector
微软开源 Anomaly Detector库,主要时间序列的异常检测。
Evaluation
TSAD 评估相关的方法也是多得很呢:) 实际上在工业界评估的标准不会有太多的选择——一般都需要转换为业务指标,如 MTTD(Mean time to detection), 准确率/误伤率等。 所以这里就不继续深入对各种评估方法进行解读了 (如果大家觉着有必要的话,欢迎 PR,或者 pin 我来补也可以)。
2022-Theseus
Theseus: Navigating the Labyrinth of Time-Series Anomaly Detection26
2022-Rigorous Evaluation
Towards a rigorous evaluation of time-series anomaly detection27
2022-Huawei-Local Evaluation
Local Evaluation of Time Series Anomaly Detection Algorithms28
2022-Volume under the surface
Volume under the surface: a new accuracy evaluation measure for time-series anomaly detection29
2022-TimeEval
TimeEval: a benchmarking toolkit for time series anomaly detection algorithms30
2022-TSB-UAD
TSB-UAD: an end-to-end benchmark suite for univariate time-series anomaly detection31
2023-SINTEF-TSAD Metric
SINTEF Digital 关于时序异常检测算法衡量指标的分析.
Footnotes
Ane Blázquez-Garcı́a et al., “A Review on Outlier/Anomaly Detection in Time Series Data,” ACM Computing Surveys (CSUR) 54, no. 3 (2021): 1–33.↩
Sebastian Schmidl et al., “Anomaly Detection in Time Series: A Comprehensive Evaluation,” Proceedings of the VLDB Endowment 15, no. 9 (2022): 1779–97.↩
Ferdinand Rewicki et al., IS IT WORTH IT? COMPARING SIX DEEP AND CLASSICAL METHODS FOR UNSUPERVISED ANOMALY DETECTION IN TIME SERIES, 2023.↩
Sebastian Schmidl et al., “Anomaly Detection in Time Series: A Comprehensive Evaluation,” Proceedings of the VLDB Endowment 15, no. 9 (2022): 1779–97.↩
Paul Boniol et al., New Trends in Time-Series Anomaly Detection, 2023.↩
Jordan Hochenbaum et al., “Automatic Anomaly Detection in the Cloud via Statistical Learning,” arXiv Preprint arXiv:1704.07706, 2017.↩
Qingsong Wen et al., “RobustTrend: A Huber Loss with a Combined First and Second Order Difference Regularization for Time Series Trend Filtering,” arXiv Preprint arXiv:1906.03751, 2019.↩
Qingsong Wen et al., “RobustSTL: A Robust Seasonal-Trend Decomposition Algorithm for Long Time Series,” Proceedings of the AAAI Conference on Artificial Intelligence 33, no. 01 (2019): 5409–16.↩
Qingsong Wen et al., “RobustPeriod: Time-Frequency Mining for Robust Multiple Periodicities Detection,” arXiv Preprint arXiv:2002.09535, 2020.↩
Jingkun Gao et al., “Robusttad: Robust Time Series Anomaly Detection via Decomposition and Convolutional Neural Networks,” arXiv Preprint arXiv:2002.09545, 2020.↩
Alexander Alexandrov et al., “GluonTS: Probabilistic and Neural Time Series Modeling in Python.,” J. Mach. Learn. Res. 21, no. 116 (2020): 1–6.↩
Sayan Chakraborty et al., “Building an Automated and Self-Aware Anomaly Detection System,” 2020 IEEE International Conference on Big Data (Big Data), 2020, 1465–75.↩
Yuanxiang Ying et al., “Automated Model Selection for Time-Series Anomaly Detection,” arXiv Preprint arXiv:2009.04395, 2020.↩
Aadyot Bhatnagar et al., “Merlion: A Machine Learning Library for Time Series,” arXiv Preprint arXiv:2109.09265, 2021.↩
Reza Hosseini et al., “A Flexible Forecasting Model for Production Systems,” arXiv Preprint arXiv:2105.01098, 2021.↩
Dhaval Patel et al., “Anomalykits: Anomaly Detection Toolkit for Time Series,” AAAI, 2022.↩
Yujing Wang et al., “Heat-RL: Online Model Selection for Streaming Time-Series Anomaly Detection,” Conference on Lifelong Learning Agents, 2022, 767–77.↩
Mononito Goswami et al., “Unsupervised Model Selection for Time-Series Anomaly Detection,” arXiv Preprint arXiv:2210.01078, 2022.↩
Sudipto Guha et al., “Robust Random Cut Forest Based Anomaly Detection on Streams,” International Conference on Machine Learning, 2016, 2712–21.↩
Alban Siffer et al., “Anomaly Detection in Streams with Extreme Value Theory,” Proceedings of the 23rd ACM SIGKDD International Conference on Knowledge Discovery and Data Mining, 2017, 1067–75.↩
Jia Li et al., “FluxEV: A Fast and Effective Unsupervised Framework for Time-Series Anomaly Detection,” Proceedings of the 14th ACM International Conference on Web Search and Data Mining, 2021, 824–32.↩
Siddharth Bhatia et al., “MemStream: Memory-Based Anomaly Detection in Multi-Aspect Streams with Concept Drift,” arXiv Preprint arXiv:2106.03837, 2021.↩
Paul Boniol and Themis Palpanas, “Series2graph: Graph-Based Subsequence Anomaly Detection for Time Series,” arXiv Preprint arXiv:2207.12208, 2022.↩
Paul Boniol et al., “Graphan: Graph-Based Subsequence Anomaly Detection,” Proceedings of the VLDB Endowment 13, no. 12 (2020): 2941–44.↩
Johannes Schneider et al., “Distributed Detection of Sequential Anomalies in Univariate Time Series,” The VLDB Journal 30, no. 4 (2021): 579–602.↩
Paul Boniol et al., “Theseus: Navigating the Labyrinth of Time-Series Anomaly Detection,” Proceedings of the VLDB Endowment 15, no. 12 (2022): 3702–5.↩
Siwon Kim et al., “Towards a Rigorous Evaluation of Time-Series Anomaly Detection,” Proceedings of the AAAI Conference on Artificial Intelligence 36, no. 7 (2022): 7194–201.↩
Alexis Huet et al., “Local Evaluation of Time Series Anomaly Detection Algorithms,” Proceedings of the 28th ACM SIGKDD Conference on Knowledge Discovery and Data Mining, 2022, 635–45.↩
John Paparrizos et al., “Volume under the Surface: A New Accuracy Evaluation Measure for Time-Series Anomaly Detection,” Proceedings of the VLDB Endowment 15, no. 11 (2022): 2774–87.↩
Phillip Wenig et al., “TimeEval: A Benchmarking Toolkit for Time Series Anomaly Detection Algorithms,” Proceedings of the VLDB Endowment 15, no. 12 (2022): 3678–81.↩
John Paparrizos et al., “TSB-UAD: An End-to-End Benchmark Suite for Univariate Time-Series Anomaly Detection,” Proceedings of the VLDB Endowment 15, no. 8 (2022): 1697–711.↩
Sondre Sørbø and Massimiliano Ruocco, “Navigating the Metric Maze: A Taxonomy of Evaluation Metrics for Anomaly Detection in Time Series,” arXiv Preprint arXiv:2303.01272, 2023.↩